073. The Y-Values Are Assumed to Be Normally Distributed
The value of the depended variable Y will vary even if the value for X remains fixed. Since Y is different almost all the time, the best regression model can do is estimate the average value for Y given any X - value. Regression analysis is based on the assumption that a linear relationship exists between X and the mean value of Y, E(Y). The regression line can be written
E(Y) = β0 + β1(X).
A point on the line denotes the average value for Y given any X-value. For this reason, the regression line is often referred to as a Mean line.
The Point to remember is that for any value of X that may occur several times, a different Y-value can be get each time. An entire distribution of different Y-values would result. Regression analysis assumes that this distribution of Y-values is Normal. This distribution is centered at the mean of these Y-values, as illustrated in Figure 7.5.
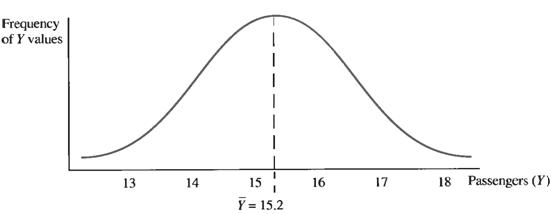
Figure 7.5 – The normal distribution of Y-values for a given single value of X (X=10)
This suggests that if the airlines spends $10000 each month on advertising for several months, the number of passengers, although perhaps different each month, will average 15200.
The normal distribution of Y-values exists for all values of X. thus, if X = 11 on many separate occasions, there would occur an entire distribution of Y-values that would be normally distributed and centered Ŷ = 16.28 0r 16280 passengers etc.
When estimating the true, but unknown regression line with a sample regression line, statisticians trying to find that line which passes through the means of the various distributions of Y-values for each X-value. This is illustrated in Figure 7.6.
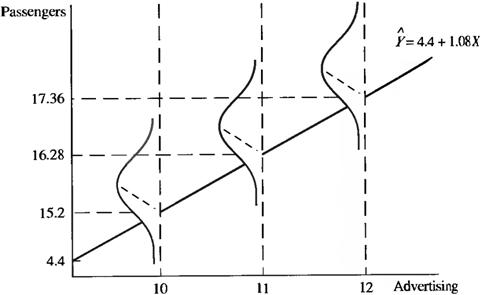
Figure 7.6 – The Normal Distributions of Y-Values for the
Various Values of X
Notice that for each value of X there is a distribution of Y-values. The regression line passes through the mean of each of those distributions. Each distribution of Y-values is normal and, like any distribution of numbers, has a variance of σ2 and a standard deviation of σ. The important point to note here is that this variance is assumed to be the same for each distribution of Y-values regardless of the X-value. That is, the variance of Y-values when X = 10 is the same as the variance Y-values when X = 11 (or anything else).
| < Предыдущая | Следующая > |
|---|