101. Average of Relatives Method
Another type of composite index is the Average of relatives index. As the name suggests, this index finds the average of several relative indexes. Formula (9.5) illustrates.
 (9.5)
(9.5)
The price of each good in a given reference period is divided by its price in the base period and multiplied by 100. The results are summed and averaged over the number of goods N
Table 9.6 – Relative Advantages and Disadvantages of Laspeyers and Paasche Indexes
|
Index |
Advantages |
Disadvantages |
|
Laspeyers |
Requires quantity data for only one time period. Thus: (1) data are obtained easier, and (2) a more meaningful comparison over time can be made since any changes can be attributed to price movements. |
Overweighs goods whose prices increase. Does not reflect changes in buying patterns over time. |
|
Paasche |
Reflects changes in buying habits since it uses quantity data for each reference period. |
Requires quantity data for each year; these data are often difficult to obtain. Since different quantities are used, it is impossible to attribute differences in the index to price changes alone. Overweighs goods whose prices decrease. |
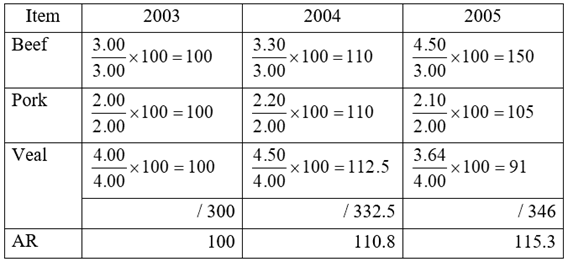
Example 9.3 Consider again the data for Nipp and Tuck. With 2003 as the base period, the average of relatives index for 2004 is found by dividing the price of each good in the reference year, 2004, by its price in the base year, and multiplying by 100. This is done for all three goods. The results are added and divided by 3 to get the average Thus, the average of relatives index for 2004 is
For beef: 
For pork: 
For veal: 
Then
![]()
Table 9.7 shows the full set of computations.
Table 9.7 – The Average of Relatives Index for Nipp and Ruck (2003=100)

On the average, prices rose by 10.8 percent from 2003 to 2004 and by 15.3 percent from 2003 to 2005. What $100 would buy in 2003 would cost $115.30 in 2005.
An obvious drawback of this method is its failure to account for weights. Although in 2003, consumers bought more beef than either of the other two products, the price of beef is given the same importance as the prices of pork and veal in calculating the index.
This deficiency is corrected by calculating a Weighted average of relatives index, Which accounts for different quantities. This is precisely what the Laspeyres and Paasche indexes do. That is, The Laspeyres and Paasche indexes are weighted average of relatives indexes.
| < Предыдущая | Следующая > |
|---|